Your Chart of Accounts Is Already Determining Your Financial Reports
And you probably made those decisions before anyone asked a single reporting question.
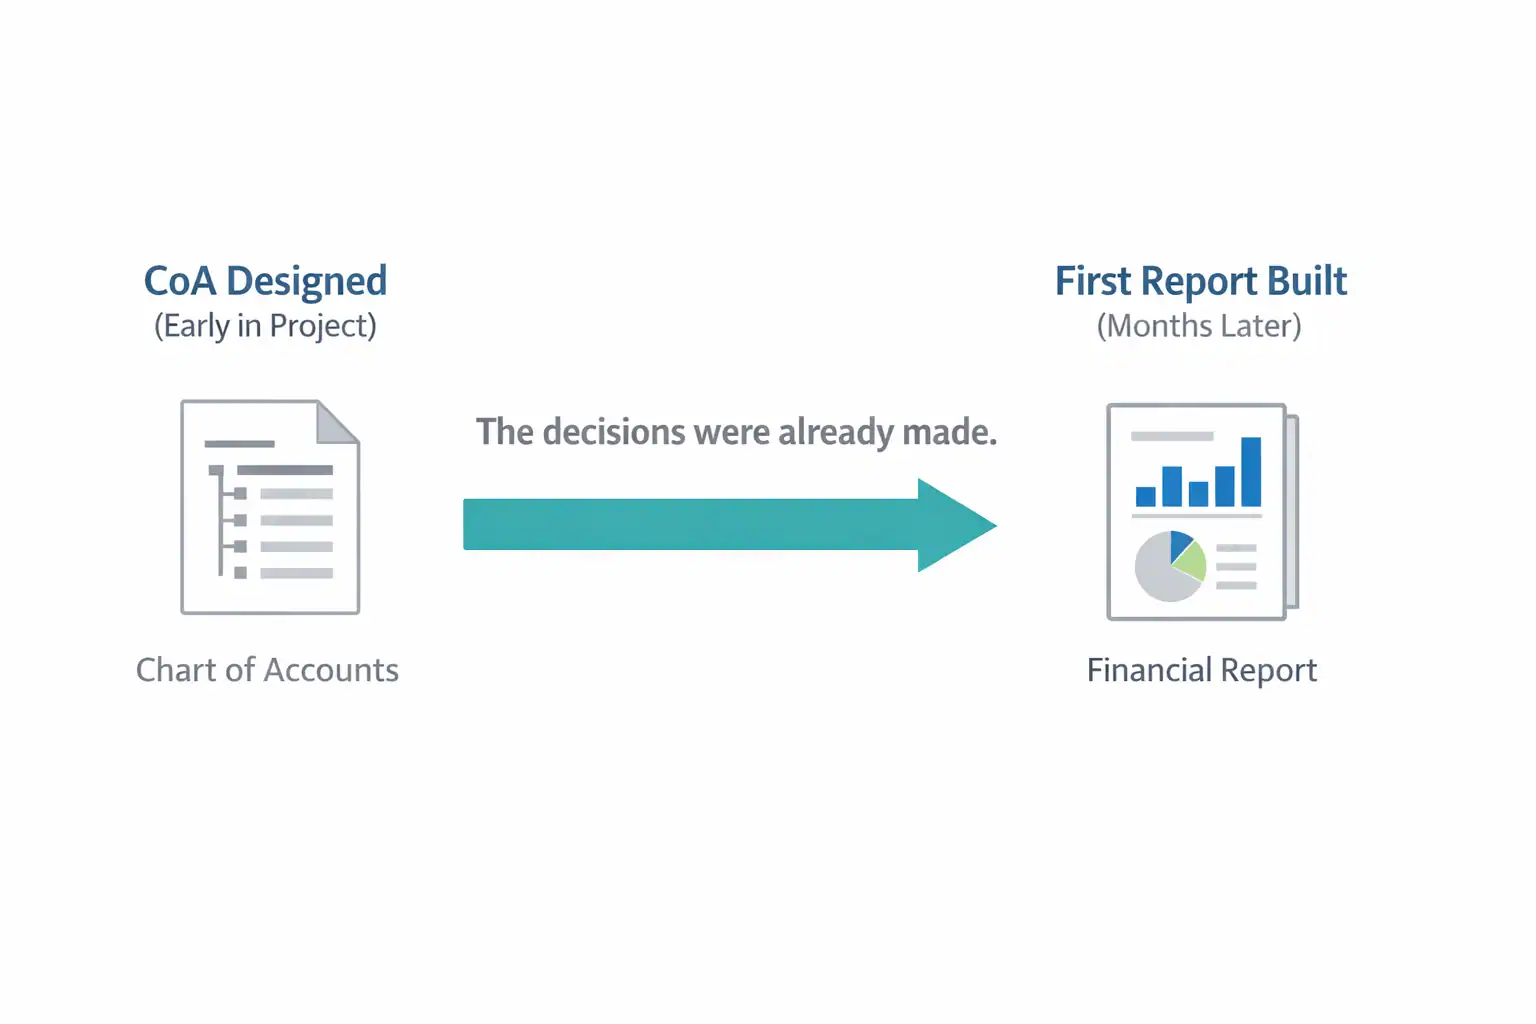
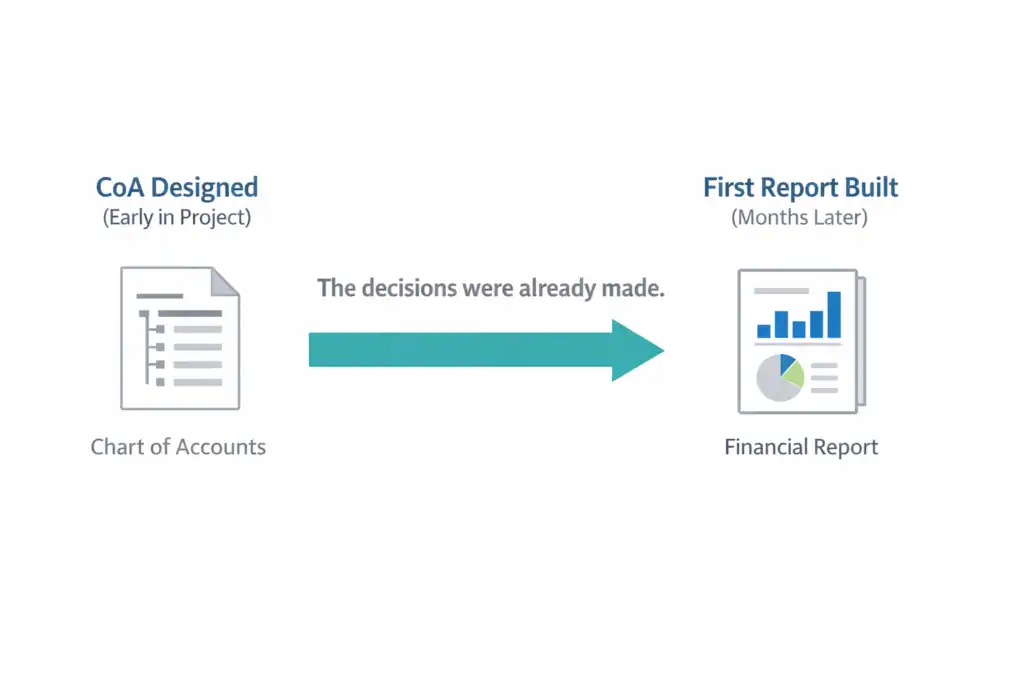
Most organizations treat the Chart of Accounts as an accounting task. It gets handed to a controller or a senior accountant early in the implementation, they build what they know, and by the time the project team asks how financial reports will look, the foundation has already been poured.
That is not a process problem. It is a sequencing problem. And it costs companies years of friction.
This series is about that friction. Where it comes from. Why it persists. And what to do about it before you run out of runway to fix it cleanly. We are starting here, with the Chart of Accounts, because everything in financial reporting in Business Central flows from it.
The Chart of Accounts Is Not a List. It Is a Set of Promises.
When you create an account, you are making a commitment. You are saying: this category of financial activity is distinct enough to track separately. That decision will echo through every report, every budget, every consolidation, and every audit for as long as that account exists.
Most people do not think of it that way. They think of the Chart of Accounts as a technical setup step. Something to get through so the project can move forward. The accounts get created, mapped from the old system, and approved. And then the real work begins. Except that was the real work. It just did not look like it at the time.
If your financial reporting is hard, slow, or fragile, the problem probably started months or years earlier. It started with the Chart of Accounts.
This is not hyperbole. It is the pattern I see again and again in Business Central implementations. The reports are slow to build. The numbers do not reconcile cleanly. The management views do not match the statutory views. Power BI is pulling data that makes no sense. And everyone is frustrated with the tool.
The tool is not the problem.
Every Account Is a Reporting Decision in Disguise
Here is a question worth sitting with: When your team created that account, what report were they imagining it would appear on?
If the answer is “we were matching our old system” or “the auditors needed it that way” or even just silence, that is worth paying attention to.
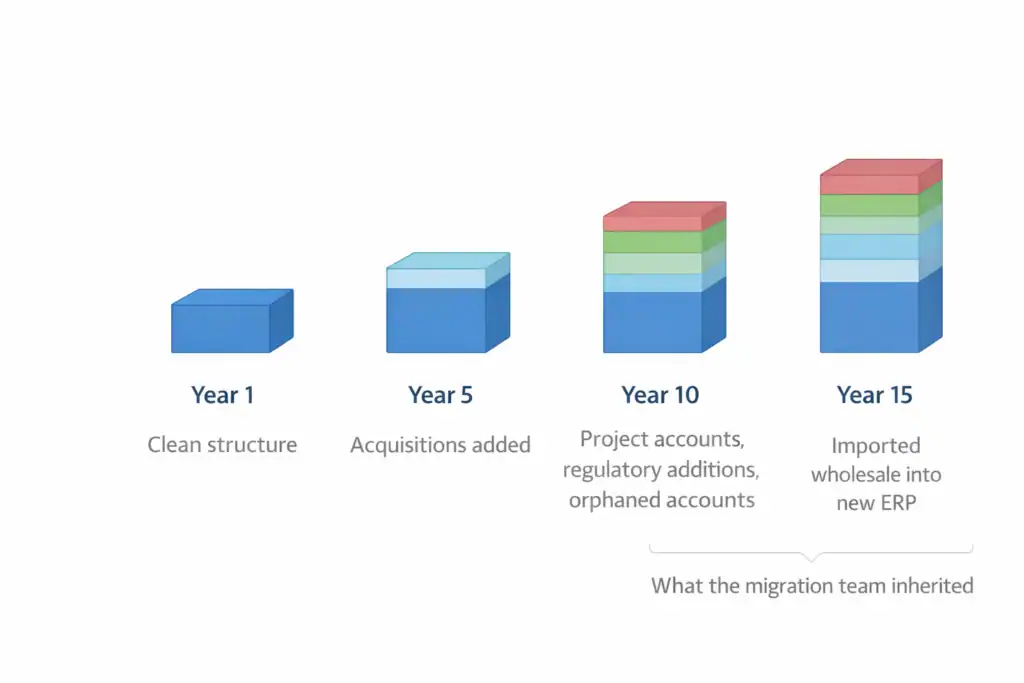
Legacy charts of accounts tend to pile up. They start as reasonable structures for an earlier time. Then the business grows, acquisitions happen, and regulations change. Someone adds an account for a specific project and never removes it. Someone else splits an account that probably should have stayed combined. Before you know it, the chart has 800 accounts, no one fully understands why half of them exist, and the migration team faithfully imports them all into Business Central.
That is not a clean slate. That is a historical artifact masquerading as a design decision.
What Makes an Account Worth Having
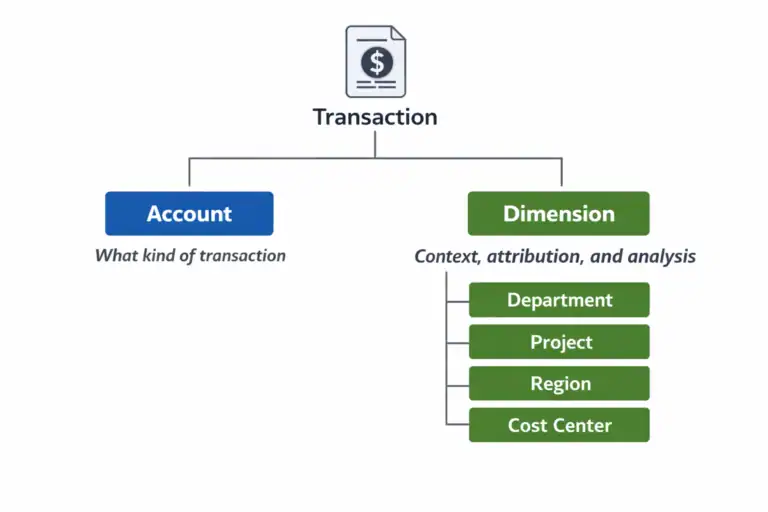
An account earns its place in the chart when it answers a question that no other account or dimension can answer on its own. That is the test. Not “does this match GAAP” or “did we have this before.” The test is: will someone build a report that needs this level of granularity, and is the account the right tool for capturing it?
Sometimes the answer is yes. Revenue by product line may genuinely need to live at the account level. Certain statutory requirements may demand it. But often, the answer is that the same reporting flexibility could be achieved through Dimensions, which are far more powerful for slicing and analyzing data without multiplying your account structure. We will cover Dimensions in depth in Part 3 of this series. For now, the key point is this: every account you add to the chart is a cost. It is a cost in complexity, in maintenance, in reporting surface area, and in the cognitive load of every person who ever has to explain the financials to someone else.
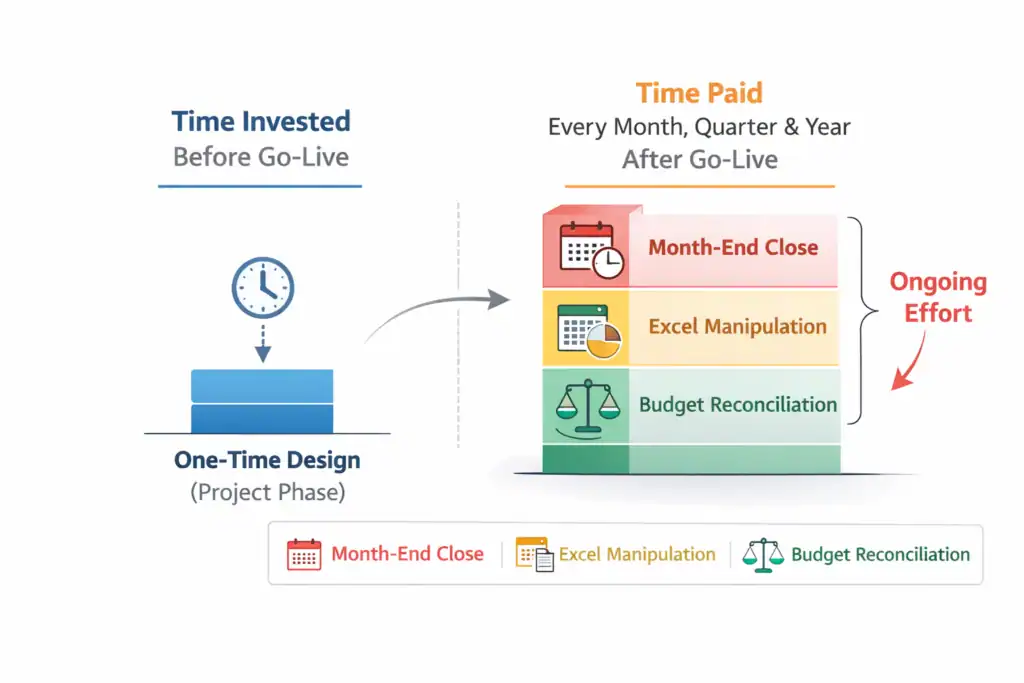
The Permanent Reporting Tax
Here is what makes Chart of Accounts decisions so consequential: they are very hard to undo.
You can change a process. You can retrain a team. You can even rebuild a dashboard. But restructuring a Chart of Accounts after transactions have been posted is a project with real risk and real cost. In some cases, organizations have decided it is cheaper to live with the bad structure than to fix it.
That is what I mean by a permanent reporting tax. You pay it every month when the close takes longer than it should. You pay it every quarter when someone manually manipulates data in Excel before it is presentable to leadership. You pay it every year when the budget process requires a heroic effort just to get to a baseline that everyone actually believes. The organizations that invest in getting the Chart of Accounts right before go-live are not spending more time. They are spending time in the right place.
The question is not whether you will spend time on financial reporting structure. The question is whether you spend that time before go-live, when it is cheap, or after, when it is expensive.
What “Right” Actually Looks Like
A well-designed Chart of Accounts in Business Central is not the most granular one. It is not the most conservative one. It is not the one that mirrors the old system most faithfully.
A well-designed Chart of Accounts is the one that makes reporting easy for the people who will live with it. That means it supports management reporting, statutory reporting, and analytical reporting without requiring a data transformation layer just to produce a number that makes sense to a human being.
It means the account structure reflects how the business actually thinks about its finances, not just how a general ledger was structured in 1998. And it means someone asked the right questions early enough to make good choices.
The Questions That Matter
Before a single account is created, every implementation should be able to answer these:
What are the financial reports that leadership cannot operate without? Not the ones they have. The ones they need.
What level of detail is required by regulation, and what level is optional? These are not the same thing, and conflating them leads to over-engineered structures.
What financial questions are we being asked today that we cannot answer? And what questions do we anticipate in the next three to five years?
Where does management reporting diverge from statutory reporting, and how will we handle that divergence? If your team cannot answer those questions before the Chart of Accounts is designed, the design will be a guess. Sometimes educated. Sometimes lucky. But a guess either way.

Why This Series Exists
Business Central is a wonderful platform. But then I have been working with it and its predecessor for 25 years, so I may be a little biased. It shines when the underlying structure supports the reporting. When it does not, the platform gets the blame. This is not a platform problem. It is a design problem.
This series is an attempt to shift that conversation upstream. Not to the software. Not to the reports. But to the decisions that shape what is possible before anyone clicks a single button.
We will walk through the design of a Chart of Accounts specifically for Business Central. We will cover which needs are best served by an account, and which belong in Dimensions. We will also talk about capturing reporting requirements before you finalize the structure, and about how that structure affects budgets, forecasts, and analytics downstream.
We will also talk about what to do when the structure is already broken, because many of you are reading this from inside an organization where that ship has sailed, and you still need a path forward. Each part of this series builds on the last. But they are also designed to stand alone, so if Part 4 on reporting requirements is where your team is struggling right now, you can start there.
Start here if you can.
The Chart of Accounts is where financial reporting is designed. Not in the report layout. Not in the BI tool. Not in the month-end close process. Everything else is downstream.
Up Next in This Series
Part 2: Designing a Chart of Accounts for Business Central (Not Your Last ERP)
Part 3: Dimensions vs Natural Accounts
Part 4: Reporting Requirements You Must Capture Before Finalizing the CoA
Part 5: How the CoA Impacts Budgets, Forecasts, and Analytics
Part 6: Retrofitting a Broken Chart of Accounts