Reporting Requirements You Must Capture Before Finalizing the Chart of Accounts
Most implementations ask what reports they need on Day 1. Almost none ask what reports they will need in Year 3. Both questions should be answered before a single account is created.
There is a step that belongs at the very beginning of every Business Central implementation. It happens before the Chart of Accounts design session. Before the dimension configuration. Before the posting group mapping. Before any of the decisions that the previous three parts of this series have covered.
This step calls for a structured, documented conversation to answer key reporting questions that guide long-term design.
Most implementations skip it. Not out of negligence, but out of pressure. There is a go-live date. There are configuration tasks piling up. The reporting conversation feels like it can happen later, after the system is running, once people can see what they are working with.
By the time later arrives, the Chart of Accounts is locked, the dimensions are configured, and the reporting foundation is set. The conversation that should have shaped those decisions is now a list of change requests that range from inconvenient to expensive.
This part of the series aims to prevent issues caused by inadequate planning. It details key reporting challenges, essential questions to ask in advance, and a framework for gathering requirements that truly guide the design process.
The Three Tensions Every Implementation Must Account For
Requirements conversations fail not because organizations ask the wrong questions, but because they do not realize they are navigating three distinct and sometimes competing sets of needs. Understanding the tensions between them is the first step toward resolving them.
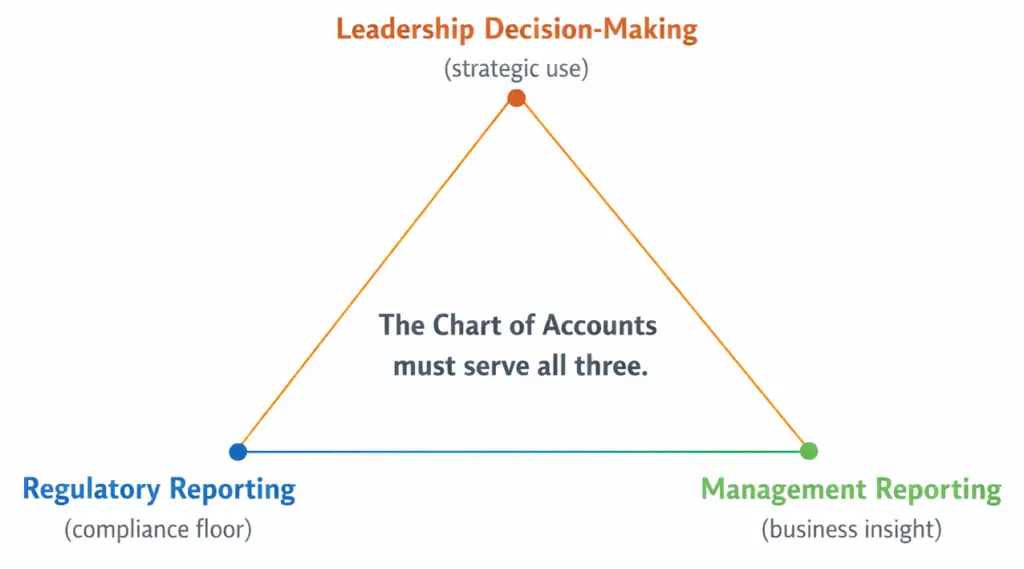
First: Regulatory vs Management Reporting
Regulatory reporting is a non-negotiable. Tax filings, statutory financial statements, audit requirements, and industry-specific compliance obligations define a floor. The Chart of Accounts must support them, and no amount of reporting elegance matters if the compliance baseline is not met.
Management reporting is where most of the value lives. It is also where most of the unmet need accumulates. The board pack. The departmental P&L. The margin analysis by product line. The operational metrics that leadership tracks month over month. These reports are not required by any regulator. They are required by the people who run the business day-to-day
The tension between them is real because they often pull the chart in different directions. Regulatory reporting usually favors a flatter, more standardized structure. Management reporting tends to want more granularity, more dimensional depth, and more flexibility. When the design session defaults to satisfying compliance first and treating management reporting as a secondary concern, the result is a chart that serves the audit well and serves the business poorly.
Both sets of requirements must be on the table simultaneously. The goal is a structure that satisfies the compliance floor without sacrificing the management ceiling.
Second: Finance Asks vs Leadership Needs
This tension is subtler and often more politically charged. Finance teams know what they produce. They know which reports they run, which reconciliations they perform, and which outputs land on the controller’s desk every month. When asked about reporting requirements, they describe those outputs faithfully.
But the reports finance produces are not always the reports leadership needs to make decisions. The CFO presenting to the board may be working from a deck that was built in PowerPoint, pulling numbers from three different sources, because the system does not produce the view leadership actually wants in a form they can use.
That gap rarely surfaces in a requirements conversation, because finance does not always know what leadership is doing with the numbers once they leave the close process. And leadership does not always know that the system could produce what they need if it were designed differently.
Capturing this tension requires talking to both groups. Not just finance. Not just IT. The people who consume the financial information at the executive level have requirements that are just as legitimate as the ones the controller can articulate, and they are far less likely to show up in a standard requirements gathering session.
Third: Day 1 Requirements vs Future-State Needs
This is the tension most implementations handle worst, and it is the one with the longest tail.
Day 1 requirements are what the organization needs the system to produce when it goes live. They are concrete, urgent, and easy to gather. Future-state requirements are what the organization will need the system to produce in two, three, or five years as the business evolves. They are speculative, easy to defer, and almost never discussed in a requirements session under go-live pressure.
The problem is that the Chart of Accounts needs to accommodate both. It is not practical to design a chart for every hypothetical future state. But it is entirely practical to ask a small set of forward-looking questions that create enough structural flexibility to avoid a painful redesign later.
Organizations that skip future-state requirements tend to discover their oversight at the most inopportune time: when an acquisition happens, and the chart cannot accommodate the new entity cleanly, or when the board asks for a new analytical cut that the structure was never designed to support, or when a new CFO arrives with a different view of how performance should be measured.
Day 1 requirements show what must be delivered at launch. Future-state needs define what the system must handle as the business evolves. Both must guide the design conversation, but often only one is discussed.
The Questions That Should Drive Every Design Session
What follows is not an exhaustive requirements template. It is the set of questions that, in my experience, most reliably surface the decisions that will matter most. They are organized by the three tensions above and designed to be asked of the right people, not just the project team.
Why the Right People Are Rarely in the Room
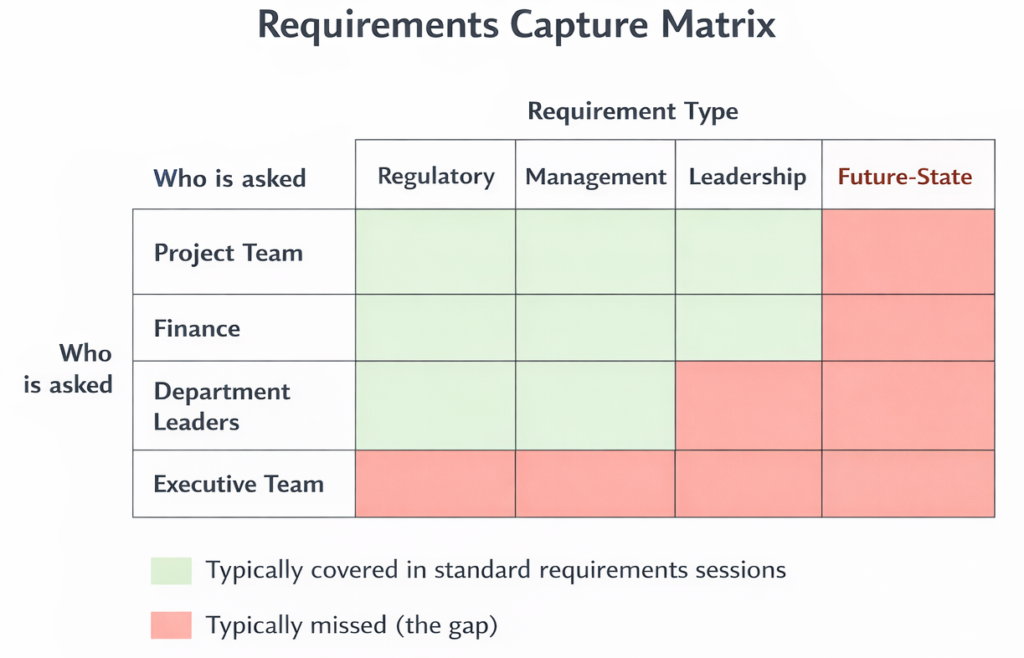
Requirements sessions for ERP implementations tend to be attended by the same group of people: the project manager, the controller or CFO, the IT lead, and a handful of department representatives. That group is typically great at capturing operational and compliance requirements. It is poorly equipped to capture executive decision-making needs and future-state considerations.
The CFO is often in the room, but wearing a different hat. In a requirements session, the CFO tends to represent the close process and the compliance obligations, not the board presentation and the strategic reporting they wish they had. Getting to the latter requires a different kind of conversation, usually one-on-one, outside the project meeting structure.
Department heads are often not in the room at all, or are represented by a finance business partner who describes the reports they receive rather than the decisions they make. The operational leader who needs gross margin by product line to make sourcing decisions has a legitimate Chart of Accounts requirement. It rarely surfaces in a standard session.
The practical fix is to expand the conversation deliberately. Before the design session, schedule short, systematic interviews with the CFO outside the project framework, with two or three department heads who are heavy consumers of financial information, and with anyone who is currently building workaround reports in Excel or PowerPoint. Those conversations will surface requirements that no project meeting will ever produce.
The requirements that most influence Chart of Accounts design are almost never the ones that surface in a standard project meeting. They come from the CFO’s board prep, the department head’s monthly frustration, and the analyst who has been building and updating the same Excel file for three years.
Turning Requirements Into Design Decisions
Gathering requirements is only useful if they actually influence the design. That sounds obvious. In practice, it is where most requirements processes break down.
The most common failure mode is a requirements document that is thorough, well-organized, and completely disconnected from the Chart of Accounts design session that happens two weeks later. The design team works from what they know. The requirements document sits in a shared folder.
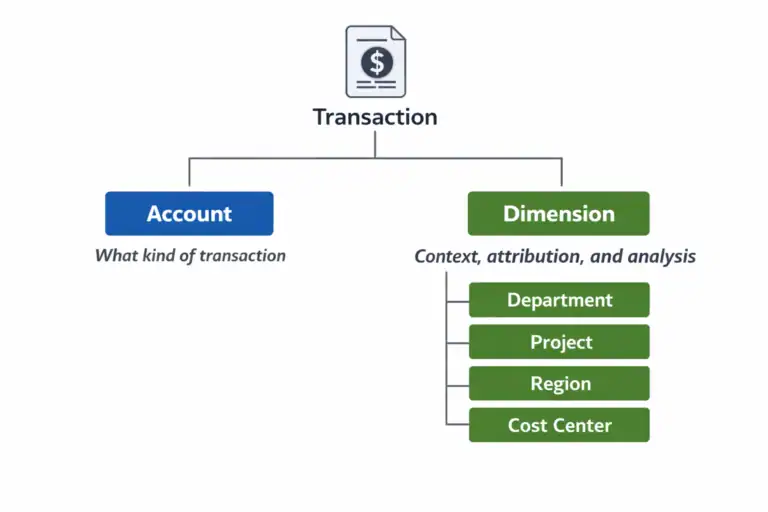
A more effective approach is to map each captured requirement explicitly to a structural decision. If the board needs revenue visibility by geography, that maps to either a set of revenue accounts segmented by region or a dimension configured for geographic attribution. The choice between those two options is a design decision, and it should be made with the requirement on the table, not after the chart is built.
This mapping does not need to be complicated. A simple table with four columns covers it: the requirement, who needs it, whether it is best served by an account or a dimension, and whether it is a Day 1 need or a future-state consideration. Working through that table before the design session starts is the most reliable way to ensure that the requirements conversation actually shapes the chart.

The Moment This Conversation Becomes Urgent
There is a specific moment in every implementation when the conversation about reporting requirements becomes urgent in a way it wasn’t before. It is the moment someone asks to see a report, and the report cannot be produced from the system without an exercise in Excel gymnastics.
That moment usually happens about three months after go-live. The close has run a couple of times. The team is getting comfortable with the system. And then the CFO asks for something that everyone assumed would be easy, and it turns out the data is not structured to support it.
That is not a Business Central problem. It is a requirements problem. The information was not captured, and the design decision never happened. And now the organization is paying the cost.
The goal of this article is to move that conversation to before the design session, where the cost of getting it right is close to zero. The questions above are designed to surface requirements that implementations routinely miss. The mapping framework is designed to make sure those requirements actually influence the decisions that matter.
Used together, they represent the difference between a Chart of Accounts designed by default and one designed by intent.
Next: how the chart affects everything downstream.
Once the Chart of Accounts and dimension structure are finalized, their influence reaches far beyond the monthly close. Part 5 will cover how the structural decisions made in design affect budgeting, forecasting, and analytical reporting, and why BI tools cannot rescue a foundation that they were not built to support.
This Series
Part 1: Your Chart of Accounts Is Already Determining Your Financial Reports
Part 2: Designing a Chart of Accounts for Business Central (Not Your Last ERP)
Part 3: Dimensions vs Natural Accounts: How to Decide What Goes Where
Part 4: Reporting Requirements You Must Capture Before Finalizing the CoA [You are here]
Part 5: How the CoA Impacts Budgets, Forecasts, and Analytics
Part 6: Retrofitting a Broken Chart of Accounts