Retrofitting a Broken Chart of Accounts
This is the part of the series for the organizations that did not get to start clean.
Maybe the implementation happened before anyone read an article like this. Maybe the chart was inherited from a predecessor system and no one had the time or the political capital to challenge it. Maybe the design conversations happened, the right questions were asked, and the answers were overruled by a controller who had managed the same chart for fifteen years and was not interested in change.
Whatever the reason, the result is the same. The chart is live. Transactions are posted. The structure is doing damage downstream, in the close process, in the budget cycle, in the analytics layer, and in the weekly conversations where finance spends more time explaining the numbers than discussing what they mean.
The question is not how to avoid this situation. The question is what to do now.
You may not be able to fix everything. But you can almost always fix more than you think, and the place to start is closer than it looks.
The honest answer is that the options are not all equally good. Some structural problems can be fixed cleanly. Some can be mitigated significantly without touching the account structure. And some require a real investment in remediation work that will not be cheap or fast. Understanding which is which is the first step toward making progress rather than just managing the symptoms.
The Warning Signs Worth Taking Seriously
Not every reporting inconvenience is a structural problem. Some friction in a financial system is normal. But there are specific patterns that reliably indicate a Chart of Accounts design problem rather than a process or training issue, and recognizing them is important because the remediation paths are different.
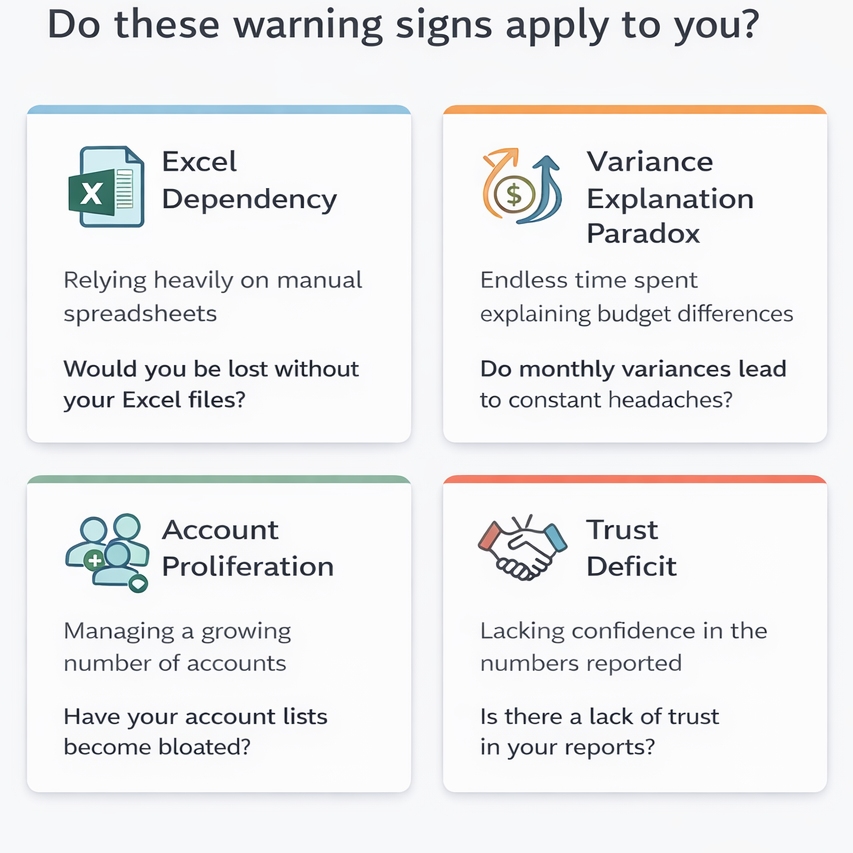
The Excel Dependency Signal
The clearest warning sign is a finance team that cannot produce the reports leadership needs without first running the numbers through one or more Excel files. Not occasionally, and not for a one-off request. Routinely. Every close. Every board pack. Every budget update.
When Excel is doing structural work that the system should be doing, it means the system’s data structure does not match the organization’s reporting needs. That mismatch can originate in the Chart of Accounts, in the dimension configuration, in the budget architecture, or in some combination of all three. But Excel is never the root cause. It is the symptom.
The test is simple: if the Excel file disappeared tomorrow, could the system produce the same output? If the answer is no, the system has a structural gap that Excel is filling.
The Variance Explanation Paradox
A related signal is a monthly close process in which variance explanations demand more effort than the analysis they support. When a finance team spends two days reconciling budget vs actual before the numbers are trustworthy enough to share, that is not a staffing problem. The data is not aligned.
As described in Part 5, budget vs actual misalignment almost always traces back to a Chart of Accounts and dimension structure that were not designed together. The budget was built against a management view. The actuals were posted against an accounting view. The gap between them requires manual reconciliation every single month.
When variance explanations are harder than they should be, the question to ask is: are the budget entries and the actual entries using the same account and dimension structure? If the answer is no, that is the problem.
The Account Proliferation Pattern
Another reliable warning sign is a chart that has been growing steadily since go-live without a clear design rationale. New accounts were added for specific projects and never retired. Accounts created to capture distinctions that should have been handled through dimensions. A numbering convention that made sense initially but has been compromised by additions that ignored the nomenclature.
Account proliferation is a sign that the chart was not designed with enough flexibility to accommodate the business as it evolved, or that the governance around additions was not strong enough to prevent ad hoc growth. Either way, the result is a chart that is harder to navigate, explain, and report from than it was at go-live.
The Trust Deficit
Perhaps the most damaging warning sign is one that does not show up in any report. It shows up when:
- A quiet organizational distrust of the financial numbers.
- Leadership routinely asks for the Excel version rather than the system version.
- Department heads use their own spreadsheets to track their budgets because the system’s view does not match how they think about their costs.
- The CFO presents to the board from a manually built deck rather than an exported one.
This trust deficit is the long-term cost of a structural problem that was never fully resolved. It is also the hardest thing to fix, because it is behavioral as much as technical. Rebuilding confidence in the numbers doesn’t require just fixing the structure, but also demonstrating, consistently over time, that the system can be trusted to produce what the business needs without manual effort.
What Can Be Fixed
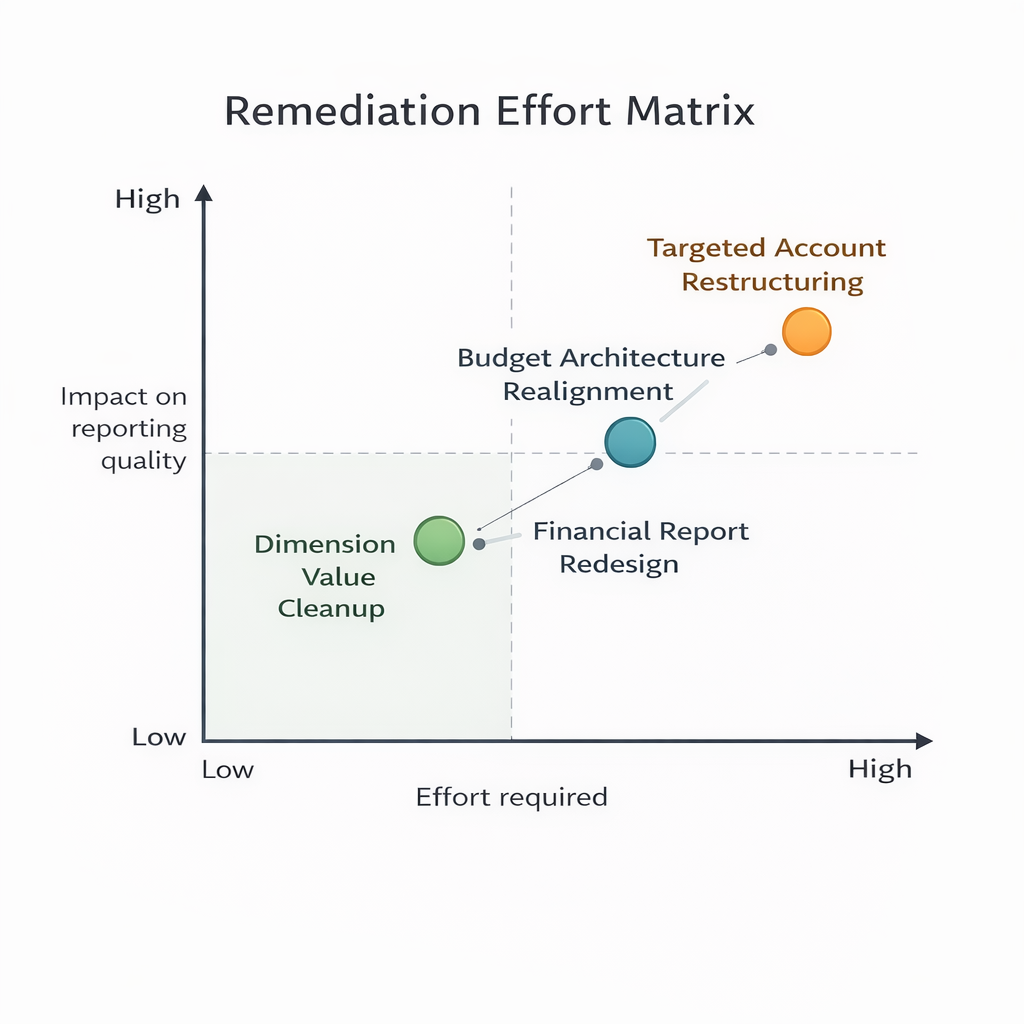
The good news, and there is genuine good news here, is that a significant amount of structural damage can be repaired without a full chart restructuring. The remediation paths below are listed roughly in order of effort, from lowest to highest.
Dimension Value Cleanup
If the primary problem is unreliable or inconsistently populated dimension data, the fix is often achievable without touching the Chart of Accounts. Dimension value cleanup involves deactivating obsolete values, standardizing naming conventions, configuring mandatory dimension rules on accounts where consistent tagging matters most, and setting default dimension values at the master record level so that future transactions are automatically tagged.
This work can be done incrementally, starting with the dimensions that drive the most reporting value and working outward. It will not retroactively fix historical data, but it will stop the bleeding and create a foundation for reliable dimension-based reporting going forward. For many organizations, this single effort produces more visible improvement in reporting quality than any other change they could make.
Budget Architecture Realignment
If the core problem is budget vs. actual misalignment and the account structure is otherwise serviceable, the fix may lie in the budget load process rather than the chart itself. Loading budget entries with matching dimension values, restructuring the budget input template to be consistent with the account structure rather than a separate management view, and eliminating the crosswalk that has been doing translation work every month are all changes that can be made without account-level restructuring.
This is not always simple, particularly if the budget process is deeply embedded in an Excel model that the finance department depends on. But it is almost always simpler than restructuring the chart, and the monthly time savings compound quickly.
Financial Report Redesign
Business Central’s Financial Reports feature, the layer that sits between the Chart of Accounts and the management reporting outputs, is more flexible than many organizations use it. When the chart structure is imperfect but not fundamentally broken, Financial Reports can often be redesigned to produce more useful management views without changing the underlying accounts.
Row definitions can group accounts in ways that match management categories even if the account numbering does not. Column definitions can produce period comparisons, budget-versus-actual views, and rolling forecasts. Account schedule extensions can pull dimension-filtered views into a standard report layout. Used creatively, Financial Reports are capable of bridging a meaningful gap between an imperfect chart and a useful reporting output.
The caveat is that Financial Reports cannot compensate for a chart that is structurally out of alignment with the business. They can improve their presentation. They cannot create data that was never captured.
Targeted Account Restructuring
When selected sections of the chart are causing disproportionate damage, targeted restructuring of those sections is often more practical than a full chart overhaul. If the revenue accounts are the source of the reporting problem, restructuring the revenue section while leaving the expense structure intact is a bounded project with an acceptable risk profile.
Targeted restructuring entails careful planning. Any account with posted transactions requires a clear data migration strategy. Depending on the volume of historical data and the organization’s tolerance for historical reporting continuity, options range from maintaining old accounts in a blocked state for historical reference while creating new ones for current activity to running a full restatement of historical data against the new structure.
The key is to scope the work to the accounts causing the most pain, rather than treating every imperfection in the chart as equally urgent. A focused approach delivers value faster and carries less risk than a wholesale restructuring.
What Cannot Be Fixed Without Real Investment
Recognition of this point matters because the organizations that underestimate the cost of a structural fix tend to make partial investments that do not thoroughly resolve the problem and end up repeating the remediation work a few years later.
A Chart That Does Not Reflect the Business Model
If the Chart of Accounts was designed for a fundamentally different version of the business, through an acquisition, a pivot, or years of organic growth that changed how the organization measures performance, targeted fixes will not be enough. The chart needs to be redesigned around the current business model, and historical data needs to be handled thoughtfully.
This is real work. It requires the same design discipline described in Parts 1 through 4 of this series: a structured requirements conversation, a deliberate account and dimension design, and a migration strategy for historical data. The difference from a greenfield implementation is that the work is done with a live system and a team that must keep operating while the restructuring continues.
The organizations that do this well treat it as a project with a dedicated workstream, adequate time, and executive sponsorship. The ones who do it poorly try to fit it inside the margins of the operational calendar, ending up with a partially restructured chart that creates its own set of reporting problems.
Unreliable Historical Data
When dimension data was not populated consistently in the early months or years of the system, historical reporting at the dimension level will always be incomplete. There is no practical way to retroactively tag transactions that were posted without dimension values, at least not at any scale.
This does not mean historical dimension-based reporting is impossible. It means it needs to be presented with appropriate contextual references regarding when the dimension data became reliable, and that year-over-year comparisons at the dimension level may have a validity horizon that starts at a specific point in time rather than at go-live.
Organizations that need clean historical dimension data for a specific purpose, a sales process, an audit, or a regulatory filing sometimes invest in a retroactive tagging exercise. That work is time-consuming and expensive, and it requires a clear business case to justify it.
Deeply Embedded Workarounds
When Excel files and manual processes have been doing structural work for long enough, they develop dependencies. Reports are built on top of them. Processes are designed around them. People are trained to maintain them. Removing them doesn’t require just fixing the underlying data structure but also rebuilding every downstream process that was designed to accommodate the workaround.
This is often the most underestimated cost of a structural remediation. The chart fix itself may be manageable. The change management required to retire the workarounds that have accumulated around the broken structure is frequently larger than the technical work.
Fixing the structure is the technical problem. Retiring what was built to work around the broken structure is the organizational problem. Both need to be in scope, or the remediation will not fully land.
Where to Start Right Now
If this article has described your organization, the most useful thing to do next is not to plan a large remediation project. It is to conduct an honest diagnostic of where the structural damage is doing the most harm.
A practical starting point for any organization
You do not need to fix everything to make meaningful progress. You need to fix the right thing first. The diagnostic tells you what that is.
A Reflection on This Series
Six parts. One central idea.
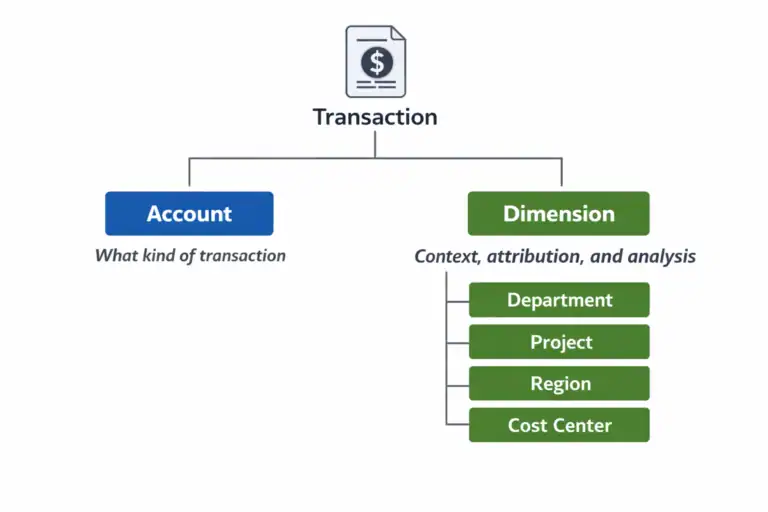
The Chart of Accounts is where financial reports are designed. Not in the report layout, not in the BI tool, not in the month-end close process. In the structural decisions made early in the implementation, often under pressure, without the right questions on the table, and by people doing their best with the information and time they had.
This series has been an attempt to put better questions on the table before those decisions are made. To name the patterns that create reporting problems years before the reporting problems surface. To give organizations and consultants a framework for thinking about financial data structure as a strategic question, not a technical one.
Parts 1 through 3 covered the design decisions themselves: the Chart of Accounts as a set of promises, the precise demands Business Central places on that design, and the Dimensions question that most implementations underinvest in.
Part 4 covered the requirements conversation that should precede every design decision, but rarely does. Part 5 covered what happens downstream when the foundation is wrong. And this part has been for the organizations that are already living with the consequences.
If I could distill everything in this series into a single piece of guidance, it would be this: spend the time on the structure before you spend the time on the reports. The structure is cheap to get right before going live. It is expensive to fix after. Every hour invested in design-phase thinking about the Chart of Accounts and dimensions returns multiples in the close process, the budget cycle, and the analytics layer for as long as the system is in use.
The organizations that do this well do not have better software. They have better foundations.
The Complete Series
Part 1: Your Chart of Accounts Is Already Determining Your Financial Reports
Part 2: Designing a Chart of Accounts for Business Central (Not Your Last ERP)
Part 3: Dimensions vs Natural Accounts: How to Decide What Goes Where
Part 4: Reporting Requirements You Must Capture Before Finalizing the CoA
Part 5: How the CoA Impacts Budgets, Forecasts, and Analytics
Part 6: Retrofitting a Broken Chart of Accounts [You are here]